Background
On 3 April 2020, Singapore instituted a month-long ‘circuit breaker’ period to reduce community spread of COVID-19. This included closure of schools and other institutes of learning, and most workplaces except essential services. Food retailers remained open for takeaway dining and food delivery only. Social gatherings of people not living in the same household, regardless of size, were banned in both public and private spaces, and people were encouraged to stay at home as much as possible.
In this analysis, we report on contact patterns and visits to public spaces among the Singapore population since the start of the ‘circuit breaker’ period. The data are based on an online survey of 1032 people conducted between the evening of 9 April 2020 and the evening of 14 April 2020. Details of the survey methodology are given at the end of the report.
Visits to public places
In the past week, respondents reported an average of 1.9 visits to supermarkets, grocery stores or wet markets and 1.6 visits to hawker centres, coffee shops or food courts. All other places, including shopping malls and parks were visited less than once on average (Table 1).
| Location | Mean | Median | 25th percentile | 75th percentile |
|---|---|---|---|---|
| Supermarket/wet market | 1.9 | 2 | 1 | 3 |
| Restaurant/bar/cafe | 0.3 | 0 | 0 | 0 |
| Hawker centre/food court | 1.6 | 1 | 0 | 2 |
| Place of worship | 0.0 | 0 | 0 | 0 |
| Shopping mall | 0.7 | 0 | 0 | 1 |
| Playground | 0.0 | 0 | 0 | 0 |
| Park | 0.7 | 0 | 0 | 1 |
Men in all age groups tended to visit parks and food retailers (including hawker centres/coffee shops/food courts and supermarkets/grocery stores/wet markets) more commonly than women (Figure 1).
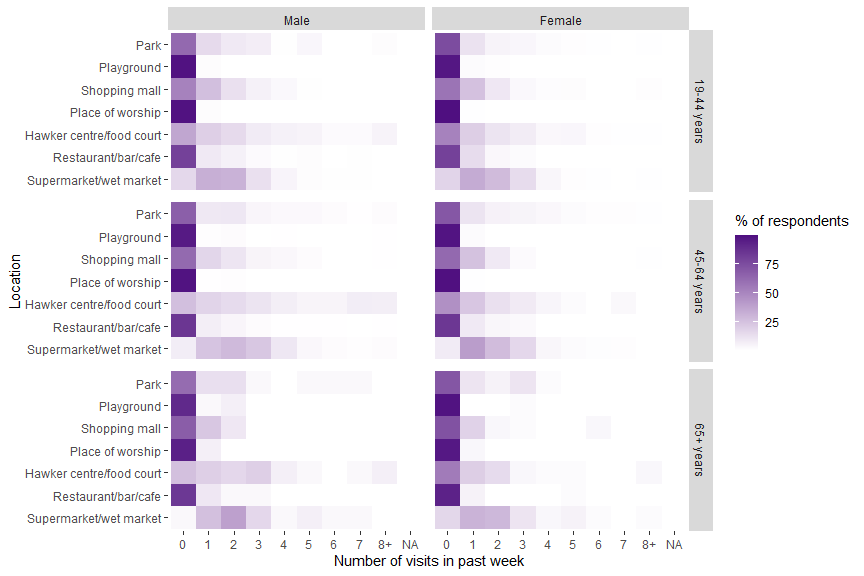
For visits to food retailers, we did not specifically ask whether food was consumed within the premises.
Contact patterns
On average respondents reported contact with less than 1 other individual in the past 24 hours, both within and outside their household. Those aged 65 years and above tended to have more contacts within the household and fewer outside the household compared with younger respondents (Table 2). There was, however, a small minority with a large number of contacts, with some individuals reporting more than 15 contacts outside their household.
| Contact type | Respondent age | Mean | (SD) | Median | Minimum | 25th percentile | 75th percentile | Maximum |
|---|---|---|---|---|---|---|---|---|
| Household | 19-44 years | 0.57 | 1.12 | 0 | 0 | 0 | 1 | 30 |
| Household | 45-64 years | 0.59 | 2.16 | 0 | 0 | 0 | 1 | 75 |
| Household | 65+ years | 0.82 | 4.97 | 0 | 0 | 0 | 1 | 88 |
| Non-household | 19-44 years | 0.71 | 5.32 | 0 | 0 | 0 | 0 | 99 |
| Non-household | 45-64 years | 0.42 | 2.48 | 0 | 0 | 0 | 0 | 70 |
| Non-household | 65+ years | 0.17 | 0.89 | 0 | 0 | 0 | 0 | 15 |
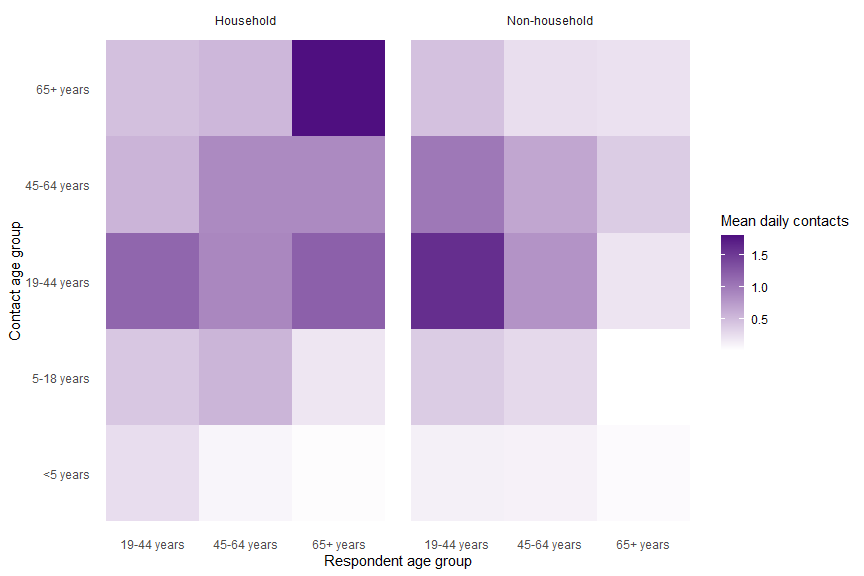
Figure 2 shows a matrix of average daily contacts between age groups. Respondents aged 65+ years reported the highest number of contacts with individuals in the same age group within the household (1.8 per day), as well as individuals aged 19-44 years (1.2 per day, likely indicative of inter-generational contact). Younger respondents aged 19-44 years reported an average of 1.2 contacts with individuals in the same age group within their household, and 1.6 contacts with individuals outside their household.
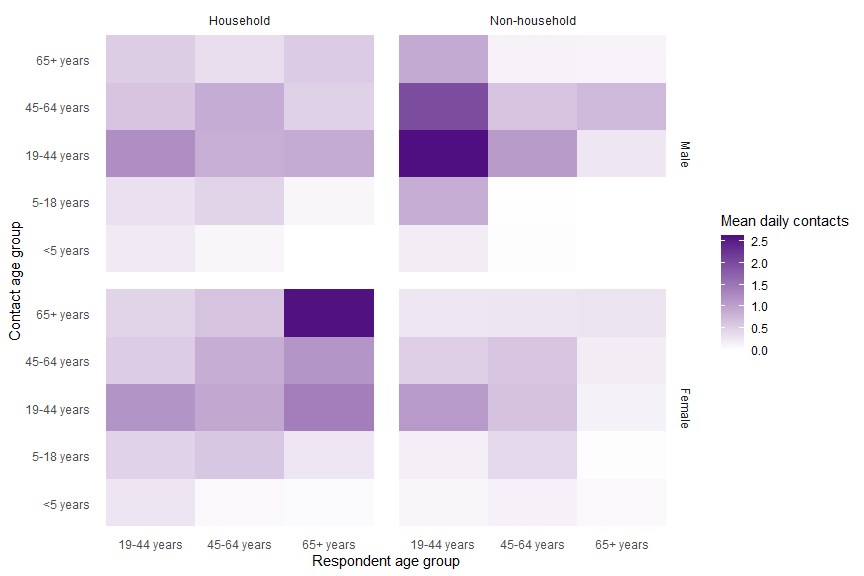
There were marked differences in contact patterns by respondent gender (Figure 3). Female respondents aged 65+ years reported more contacts with other individuals of the same age group within their household (~2.6 contacts per day on average), while male respondents aged 19-44 years reported more contacts with individuals in the same age group outside their household (~2.6 contacts per day on average).
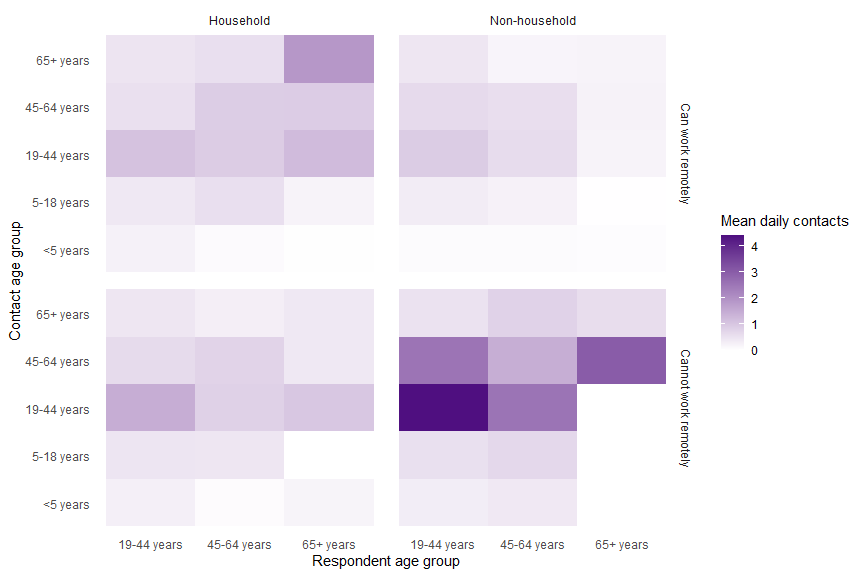
It should be noted that for contacts with individuals outside the household, we did not specifically ask respondents whether these occurred as part of work or other activities. However, analysis by work status suggests that these largely correspond to contacts for respondents whose job cannot be done remotely.
Survey methodology
Between 9 April and 14 April 2020, we placed advertisements on Facebook with a link to an online survey questionnaire. The advertisements were targeted at Facebook users in Singapore. Users clicking on the survey link were taken to a webpage with information about the purpose of the study. Respondents completed the survey anonymously and no remuneration was provided for completing the survey.
The survey questionnaire comprised eight sections with questions on knowledge, sources of solicited and unsolicited information, self-efficacy and information needs, anxiety, confidence in authorities, acceptance of quarantine measures, behavioural changes in response to the epidemic, and socio-demographic characteristics. For this survey round, we additionally included questions related to visiting public places and contact with other individuals.
Respondents were asked the following questions: 1. In the past week how many times have you visited the following? - Supermarket, grocery store, wet market - Restaurant, bar, cafe - Hawker centre, coffee shop, food court - Place of worship - Shopping mall - Playground - Park
-
In the past 24 hours, how many people in your own household in each of these age groups have you had close contact with? By close contact we mean touching or having a conversation with someone <2 metres away.
-
In the past 24 hours, how many people outside your household in each of these age groups have you had close contact with? By close contact we mean touching or having a conversation with someone <2 metres away. For questions 2 and 3, respondents were asked to report contacts with people in the following age groups: <5 years, 5-18 years, 19-44 years, 45-64 years, 65+ years. The survey was administered using REDCap software. Ethical approval for this survey was provided by the Departmental Ethics Review Committee of the Saw Swee Hock School of Public Health, National University of Singapore (SPH-003; SPH-004).
Participation
A total of 1067 completed surveys were collected. Survey completion was 80.1% (based on the number of completed surveys out of users who initiated the survey).
Respondents who reported not currently residing in Singapore (n = 7) and individuals aged <21 years or with implausible or missing age were excluded from the analysis (n = 28).
Of the remaining 1032 respondents, 671 (65%) were female and 337 (32.7%) male; information on gender was missing for 24 (2.3%) individuals. Respondent demographics are presented in Table 3.
| Overall (N=1032) | |
|---|---|
| gender | |
| - N-Miss | 2 |
| - Male | 337 (32.7%) |
| - Female | 671 (65.1%) |
| - Non-binary | 0 (0.0%) |
| - Prefer not to say | 22 (2.1%) |
| ethnicity | |
| - N-Miss | 4 |
| - Chinese | 771 (75.0%) |
| - Malay | 57 (5.5%) |
| - Indian | 67 (6.5%) |
| - Other | 104 (10.1%) |
| - Prefer not to say | 29 (2.8%) |
| education | |
| - N-Miss | 4 |
| - No formal qualifications/lower primary | 0 (0.0%) |
| - Primary (PSLE) | 7 (0.7%) |
| - Secondary (O/N Level) | 134 (13.0%) |
| - A Level/Polytechnic/Diploma | 234 (22.8%) |
| - ITE/NTC | 25 (2.4%) |
| - University | 596 (58.0%) |
| - Prefer not to say | 32 (3.1%) |
| marital | |
| - N-Miss | 2 |
| - Currently married | 565 (54.9%) |
| - Divorced | 59 (5.7%) |
| - Never married | 325 (31.6%) |
| - Separated but not divorced | 14 (1.4%) |
| - Widowed | 13 (1.3%) |
| - Prefer not to say | 54 (5.2%) |
| housing | |
| - 1-2 room HDB | 28 (2.7%) |
| - 3-4 room HDB | 397 (38.5%) |
| - 5-room HDB/executive flat | 260 (25.2%) |
| - Private housing | 292 (28.3%) |
| - Others | 24 (2.3%) |
| - Do not know | 3 (0.3%) |
| - Prefer not to say | 28 (2.7%) |
| income | |
| - N-Miss | 7 |
| - \< $2,000 | 96 (9.4%) |
| - $2,000 - $3,999 | 149 (14.5%) |
| - $4,000 - $5,999 | 156 (15.2%) |
| - $6,000 - $10,000 | 174 (17.0%) |
| - \> $10,000 | 233 (22.7%) |
| - Prefer not to say | 217 (21.2%) |